Überblick
Deskriptive Statistik bildet die Grundlage für die Analyse von Unternehmensdaten, indem sie hochvolumige Datensätze in quantitative Maße zusammenfasst. Durch numerische und grafische Zusammenfassungstechniken, wie Maße der zentralen Tendenz (Mittelwert, Median, Modus) und Variabilität (Bereich, Varianz, Standardabweichung), ermöglichen deskriptive Statistiken Organisationen, Datenverteilungen zu bewerten, Anomalien zu identifizieren und Basiskennzahlen zu etablieren.
In einer Zeit, in der die globale Datensphäre über 220 Zettabyte hinausschlägt und über 90 % der Unternehmensinformationen unstrukturiert oder komplex bleiben, können Rohdaten allein schon eine Belastung darstellen, bevor sie zu einem Vermögenswert werden. Beschreibende Statistiken dienen als Hauptantrieb der Unternehmensintelligenz und verdichten chaotische, volumenreiche Datensätze in klare, umsetzbare Maße für zentrale Tendenz, Streuung und Verteilungsform. Durch die direkte Ausführung dieser Kernzusammenfassungsfunktionen in nativen Datenbankumgebungen – wodurch Latenz, Ausgangskosten und Sicherheitsrisiken eliminiert werden – schaffen Organisationen die verlässlichen empirischen Basislinien, die für die Prüfung der Datenqualität, die Optimierung der operativen Entscheidungsfindung und die Versorgung leistungsstarker KI-Pipelines erforderlich sind.
Wichtige Erkenntnisse
- Deskriptive Statistiken fassen numerische Eigenschaften zusammen, ohne unbegründete Populationsannahmen zu treffen, und bieten eine entscheidende Validierung der Datenqualität.
- Eine vollständige Datenexploration erfordert die Messung der zentralen Lage (Mittelwert, Median, Modus), Streuung (Varianz, Standardabweichung, Interquartilbereich) und Verteilungsform.
- Das Ausführen statistischer Transformationen innerhalb der Teradata-Datenbank eliminiert Netzwerklatenz, Cloud-Egress-Gebühren und die Sicherheitsrisiken, die mit Datenextraktion einhergehen.
- Saubere beschreibende Baselines bereinigen Feature-Pipelines, verhindern Modellabweichungen und gewährleisten hochpräzise Eingaben für Workflows mit künstlicher Intelligenz.
Deskriptive Statistik in der Datenanalyse
Was beschreibende Statistik ist: Die Definition
Beschreibende Statistik fasst Rohdaten in strukturierte mathematische und visuelle Zusammenfassungen zusammen, die Kerneigenschaften hervorheben.
Analysten übersetzen massive Tabellen in klare Indikatoren für zentrale Lage, Verteilung und Verteilungsform, ohne über direkte Beobachtungen hinauszugehen. Bei der anfänglichen Datenexploration fungieren deskriptive Statistiken als wesentlicher Qualitätsgate. Sie decken fehlende Werte, verzerrte Verteilungen und statistische Ausreißer auf, die sonst die nachgelagerte analytische Leistung verzerren könnten.
Wie es zur Enterprise-Analytics-Reise passt
Die Etablierung empirischer Basislinien ermöglicht es Organisationen branchenübergreifend, operative Entscheidungen zu optimieren.
- Gesundheitsversorgung: Sammelt Patientenvitalzeichen, Behandlungszeitpläne und Wiederaufnahmeraten, um Ausgangswerte für Standardbehandlungsergebnisse zu erstellen und die Konsistenz klinischer Protokolle zu verbessern.
- Finanzdienstleistungen: Fasst Transaktionsvolumen, Kontosalden und Kredit-Score-Verteilungen zusammen, um Risikobenchmarks festzulegen und Compliance-Schwellenwerte zu überwachen.
- Einzelhandel und E-Commerce: Analysiert durchschnittliche Bestellwerte, Kaufhäufigkeiten und Rückgavierquoten über Kundensegmente hinweg, um Preisgestaltung und Lagerzuteilung zu optimieren.
- Lieferkette und Fertigung: Verfolgt Komponententoleranzkennzahlen, Versandlieferzeiten und Durchsatzraten, um operative Engpässe vor kostspieligen Verzögerungen zu identifizieren.
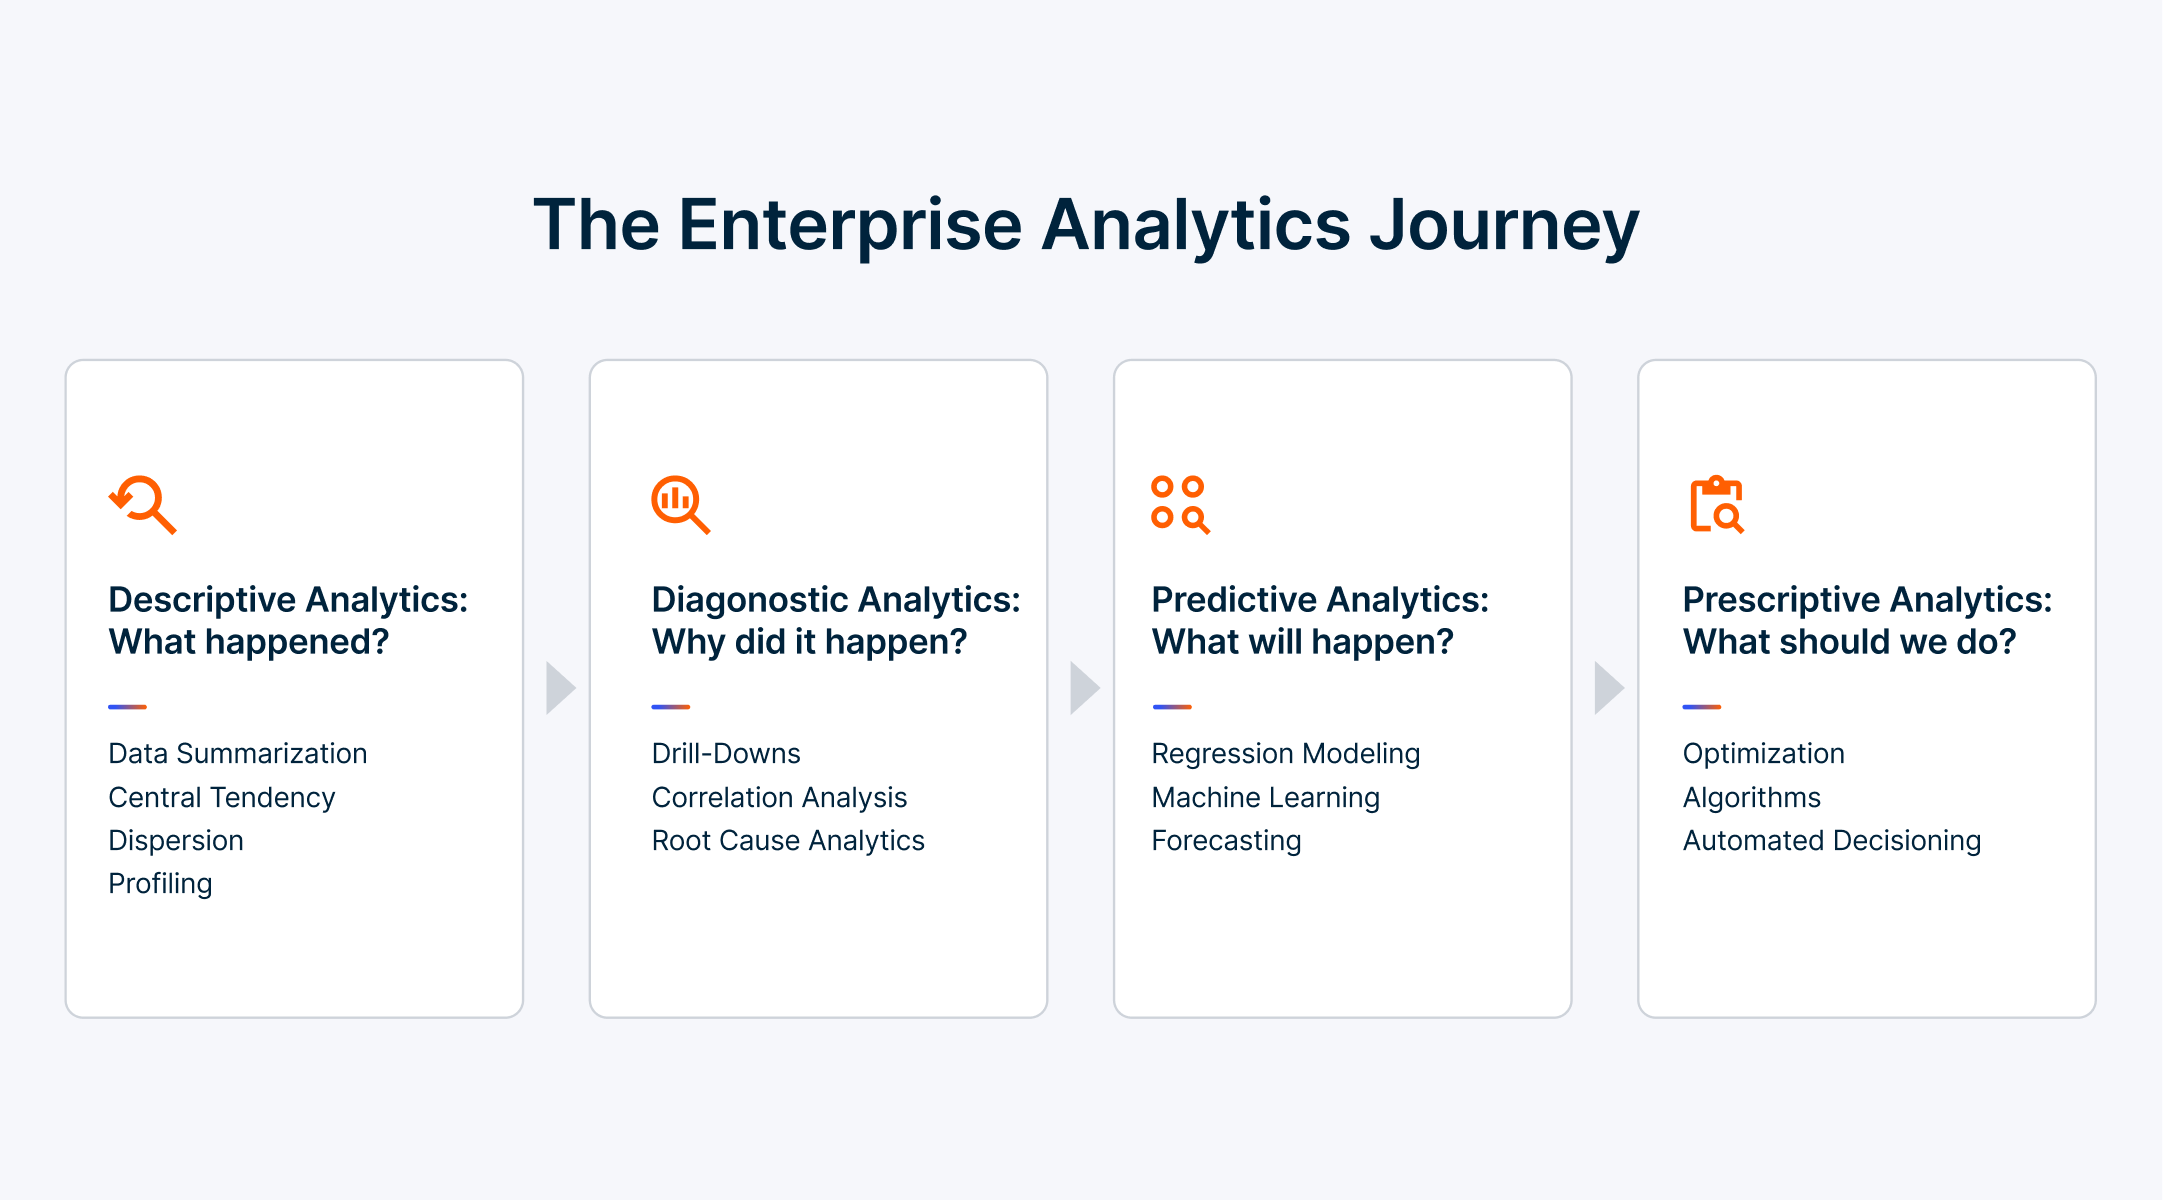
Mit der Teradata-Plattform führen Datenteams diese Kern-Erkundungsfunktionen direkt dort aus, wo sich die Daten befinden, wodurch die mit der traditionellen Datenextraktion verbundenen Leistungseinbußen eliminiert wird. Bevor Dateningenieure Upstream-Daten ausführen, Transformationstechniken wählen oder komplexe Prädiktionsmodelle einsetzen, führen sie explorative statistische Analysen durch. https://www.teradata.de/insights/data-analytics/what-is-predictive-analytics
Geschäftsmässige Auswirkungen deskriptiver Statistiken
Von Rohdaten bis zu Entscheidungen der Geschäftsleitung
Empirische Datenzusammenfassungen ermöglichen es Unternehmensleitern, die Intuition durch konkrete Beweise zu ersetzen. Da der globale Markt für Big-Data-Analysen auf 447 Milliarden US-Dollar wächst, schaffen Organisationen, die Baseline-Zusammenfassungen meistern, stärkere Grundlagen für fortgeschrittene prädiktive und vorschreibende Entscheidungsfindung.
Verbindung von deskriptiver Analytik mit prädiktiven Modellen
Die direkte Verbindung deskriptiver Analytik mit prädiktiven Modellen erzeugt einen kontinuierlichen Intelligenzzyklus. Deskriptive Statistiken etablieren historische Muster und identifizieren Merkmalsbeziehungen, wodurch maschinelle Lernalgorithmen die Nachfrage vorhersagen, Kundenfluktuation vorhersagen oder Geräteverfälle mit höherer Genauigkeit erkennen können. Regressionstechniken wie die lineare Regression bauen direkt auf diesen zusammenfassenden Maßen auf.
- Gesundheitswesen und Lebenswissenschaften: Gesundheitssysteme aggregieren Patientenkennzahlen, überwachen Vitalzeichen-Baselines und berechnen Abweichungen bei den Genesungsergebnissen zwischen den Patientendemografien.
- Finanzdienstleistungen: Risikomanager verlassen sich auf Standardabweichungen und Varianz, um die Portfoliovolatilität zu bewerten, Anomaliemuster in den Kreditscores zu erkennen und Betrugsraten zu überwachen. In der Smart Manufacturing ermöglichen diese statistischen Methoden die Qualitätskontrolle mit Echtzeit-SPC (statistischer Prozesssteuerung ).
- KI und maschinelles Lernen : KI-Teams berechnen beschreibende Statistiken zu Embedding-Verteilungen, Tokenlängen und Trainingskorpora, um ausgewogene Eingaben für große Sprachmodelle (LLMs) und Retrieval-Augmented Generation (RAG)-Pipelines sicherzustellen.
Industrieanwendungen
|
Industriezweig |
Primäre deskriptive Anwendung |
Kernkennzahlen erfasst |
Strategisches Geschäftsergebnis |
|
Einzelhandel |
Verkauf und Lagerverteilung |
Mittlerer Tagesumsatz, Interquartilbereich des Lagerumschlags, Spitzenzeiten der Bestellzeiten |
Reduzierte Lagerbestände, optimierte Sicherheitsbestände und gezielte Aktionsplanung |
|
Gesundheitswesen |
Klinische und Patientenanalyse |
Mediandauer des Aufenthalts, Abweichungen in der Genesungszeit, Häufigkeit der Wiederaufnahmen |
Verbesserte Ressourcenzuweisung, standardisierte Versorgungswege und geringere Krankenhauskosten |
|
Finanzdienstleistungen |
Portfolio - und Risikoprofilierung |
Volatilität (Standardabweichung), durchschnittliche Zahlungsausfallraten, mittlere Kredit-Scores |
Verfeinerte Kreditgrenzen, verbesserte risikoadjustierte Renditen und schnelle Betrugserkennung |
|
Telekommunikation |
Netzwerkleistung und Fluktuation |
Mittlere Latenz, Varianz im Bandbreitenverbrauch, monatliche Perzentile für aktive Abonnenten |
Proaktive Kapazitätsplanung, verbesserte SLA-Compliance und gezielte Bindungskampagnen |
|
Lieferkette |
Durchsatz - und Toleranzüberwachung |
Komponententoleranzmetriken , Versandlieferzeiten, Durchsatzraten |
Engpässe erkannt , bevor sie zu kostspieligen Verzögerungen werden |
|
KI- und ML-Engineering |
Profilierung von Merkmalen und Trainingsdaten |
Einbettungsverteilungen, Tokenlängen, Nullzählungen über Trainingskorpora hinweg |
Symmetrische Modelleingaben, weniger Drift und qualitativ hochwertigere KI-Ausgaben |
Arten deskriptiver Statistiken
Das Verständnis der Datenverteilung erfordert die Bewertung von drei fundamentalen statistischen Eigenschaften: zentrale Tendenz, Streuung und relative Position.
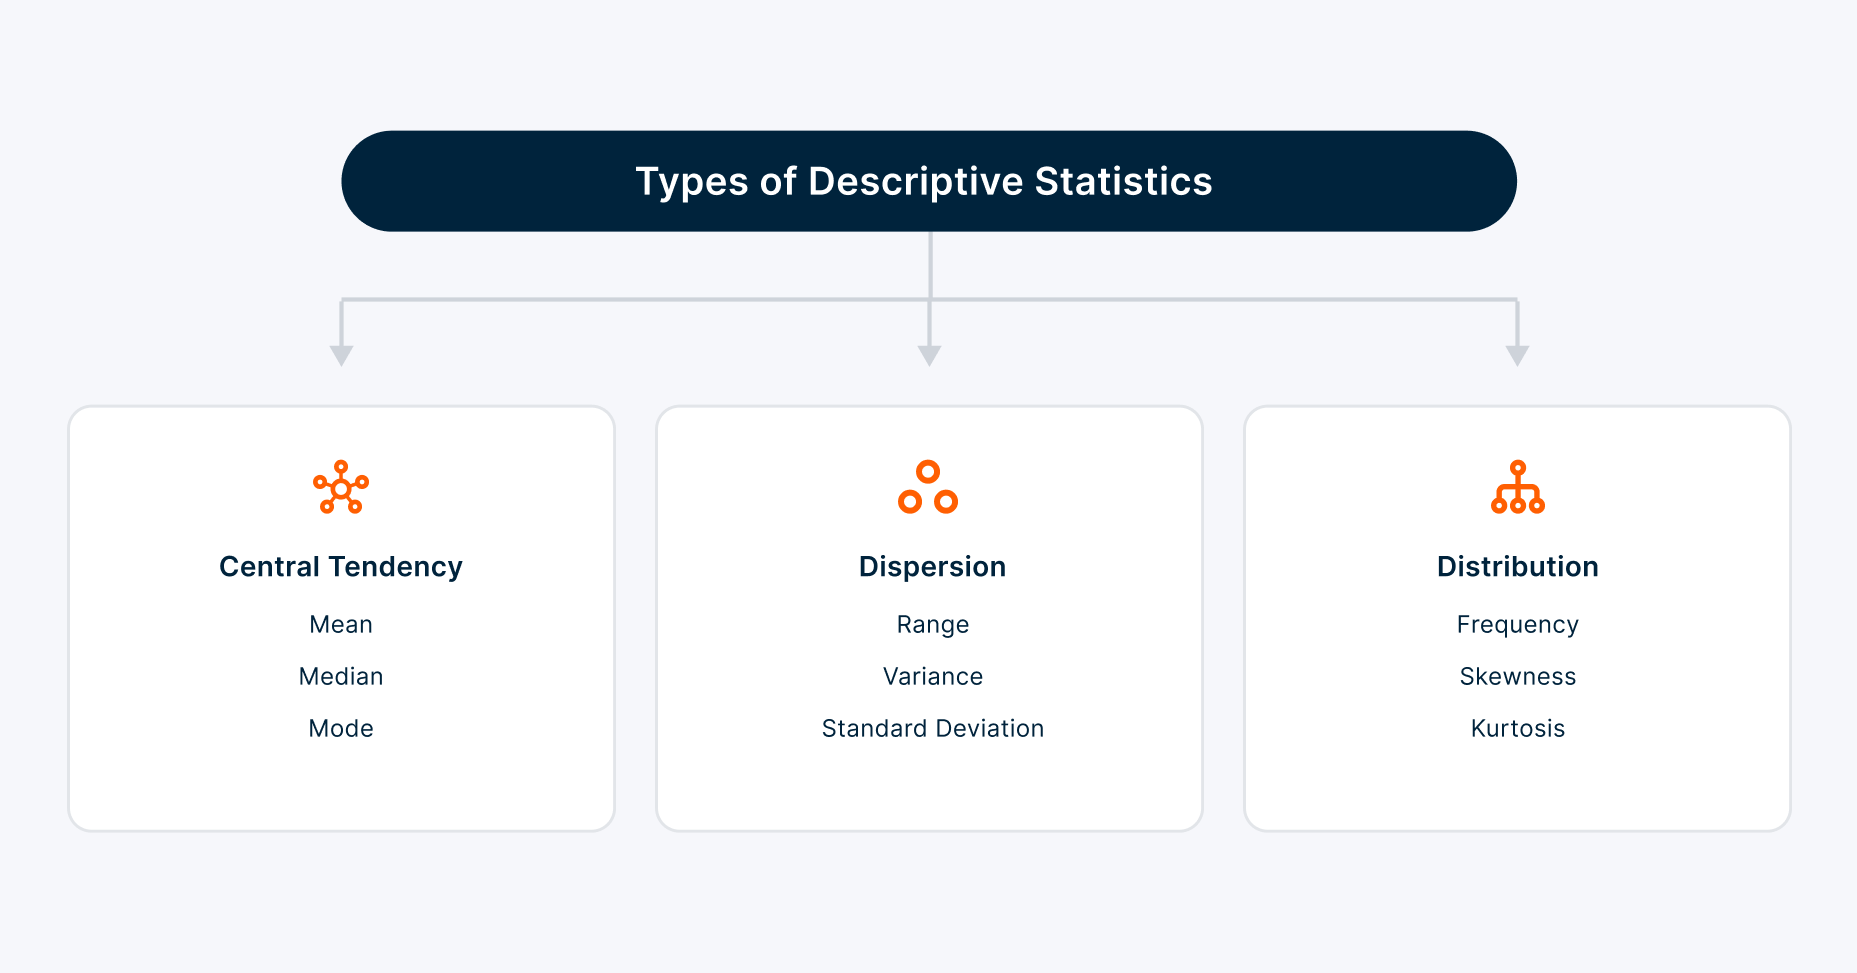
1. Maße der zentralen Tendenz
Messgrößen der zentralen Tendenz identifizieren den Mittelpunkt oder den einzelnen repräsentativen Wert eines Datensatzes.
- Mittelwert: Der arithmetische Durchschnitt aller Datenpunkte. Sehr empfindlich gegenüber extremen Werten oder Ausreißern.
- Median: Der mittlere Wert, wenn Datenpunkte in der richtigen Reihenfolge angeordnet sind. Robust gegen verzerrte Daten und extreme Ausreißer.
- Modus: Der Wert, der am häufigsten in einem Datensatz vorkommt. Nützlich für kategorische Datenanalysen (z. B. meistverkaufte Produkt-SKU).
2. Dreifungsmaße (Variabilität)
Streuungsmaße beschreiben, wie verteilt Datenpunkte relativ zum zentralen Wert sind.
- Bereich: Die Differenz zwischen den maximalen und minimalen Werten in einem Datensatz.
- Varianz: Die durchschnittliche quadratische Abweichung jedes Datenpunkts vom Mittelwert und quantifiziert die gesamte Variabilität des Datensatzes.
- Standardabweichung: Die Quadratwurzel der Varianz, die die Verteilung in derselben physikalischen Einheit wie die ursprünglichen Datenpunkte ausdrückt.
- Interquartilbereich: Die Verteilung der mittleren 50 % der Werte, wobei extremes Schwanzverhalten herausgefiltert wird.
3. Positions- und Häufigkeitsmaße
Positions- und Frequenzmessungen beschreiben, wo einzelne Werte im geordneten Datensatz liegen.
- Frequenzverteilungen: Zählungen zeigen, wie oft einzelne Werte oder versteckte Bereiche in einem Datensatz auftreten.
- Perzentile und Quartile: Unterteilt geordnete Daten in Hundertstel oder Viertel und legt relative Ranglisten über Kunden, Konten oder Leistungskennzahlen her.
- Interquartilbereich (IQR): Misst die Streuung der mittleren 50 % der Werte und gibt einen Überblick über die Verteilung, die nicht von extremen Ausreißern beeinflusst wird.
Metriken auf einen Blick
|
Metrik |
Kategorie |
Klarsprachige Definition |
Beste Geschäftsanwendung |
|
Mittel |
Zentrale Tendenz |
Der arithmetische Durchschnitt jedes Wertes in der Menge |
Baseline-Benchmarking, bei dem die Daten im Großen und Ganzen symmetrisch sind – durchschnittliche Bearbeitungszeit, durchschnittlicher Auftragswert |
|
Median |
Zentrale Tendenz |
Der mittlere Wert, sobald die Daten geordnet sind |
Jede verzerrte Verteilung: Gehaltsbänder, Schadensbeträge, Reaktionszeiten mit langem Schwanz |
|
Modus |
Zentrale Tendenz |
Der Wert, der am häufigsten auftritt |
Kategoriale Daten – häufigster Fehlercode, häufigste Korbgröße |
|
Verbreitung |
Verbreitung |
Der Abstand zwischen dem größten und dem kleinsten Wert |
Eine schnelle erste Lektüre über Volatilität, bevor man tiefer profiliert wird |
|
Standardabweichung |
Verbreitung |
Typischer Abstand eines Wertes vom Mittelwert in den ursprünglichen Einheiten |
Prozesssteuerung und Risikogrößen, bei denen Konsistenz genauso wichtig ist wie der Durchschnitt |
|
Interquartilbereich |
Verbreitung |
Die Verteilung der mittleren Hälfte der Daten |
Ausreißer-resistente Variabilität und die Grundlage der Box-Plot-Zäune |
|
Perzentile |
Position |
Der Wert, unter den ein gegebener Anteil der Beobachtungen liegt |
Service-Level-Ziele, z. B. Latenz im 95. Perzentil, Lieferzeit im 90. Perzentil |
|
Schrägheit |
Verbreitungsform |
Egal, ob die Verteilung nach links oder rechts tendiert |
Zwischen Mittelwert und Median entscheiden, bevor eine Zahl einen Bericht erreicht |
|
Kurtosis |
Verbreitungsform |
Wie schwer die Schwänze im Verhältnis zu einer normalen Kurve sind |
Kennzeichnung seltener, aber extremer Ereignisse in Risiko- und Betrugsdaten |
Deskriptive vs. inferentielle Statistik
Die Anwendung der richtigen Analyse erfordert das Verständnis grundlegender statistischer Unterschiede.
- Beschreibende Statistik: Konzentriert sich ausschließlich auf die Organisation, Zusammenfassung und Präsentation beobachteter Daten (egal ob Stichprobe oder vollständige Population), ohne über den Datensatz hinauszugehen.
- Inferenzielle Statistik: Nimmt Stichprobendaten und wendet Wahrscheinlichkeitstheorie an, um Schlussfolgerungen zu ziehen, Hypothesen zu testen oder Vorhersagen über eine breitere Population zu treffen.
Stichproben- vs. Populationsparameter
- Populationsparameter: Ein fester Wert, der eine gesamte Gruppe beschreibt, wie zum Beispiel den Populationsmittelwert oder die Populationsstandardabweichung. Die Berechnung exakter Populationsparameter ist oft kostengünstig oder unpraktisch.
- Stichprobenstatistik: Ein zusammenfassender Wert, der aus einer repräsentativen Teilmenge der Population berechnet wird und zur Schätzung des entsprechenden Populationsparameters verwendet wird.
Univariate vs. multivariate Analyse
- Univariate Statistik: Bewertet eine einzelne Variable isoliert – zum Beispiel die Verteilung des Kundenalters –, um deren zentralen Punkt, Verteilung und Form zu verstehen.
- Multivariate Statistiken: Bewertet zwei oder mehr Variablen gleichzeitig – zum Beispiel die Beziehung zwischen Kundenalter, Einkommen und Transaktionshäufigkeit –, um Korrelationen, Interaktionen und multidimensionale Muster aufzudecken.
Visualisierung deskriptiver Statistiken
Datenvisualisierung übersetzt komplexe numerische Ausgaben in intuitive grafische Darstellungen, sodass Unternehmensteams Muster und Anomalien sofort erkennen können.
Wichtige visuelle Profilierungswerkzeuge
- Balkendiagramme: Vergleichen Sie diskrete Kategorien mit Zusammenfassungen wie Gesamtumsatz oder durchschnittlicher Bestellfrequenz.
- Histogramme: Zeigen die Frequenzverteilung kontinuierlicher numerischer Daten, gruppiert in Bins, wobei Symmetrie, Verräumtheit oder multimodale Verteilungsformen sichtbar werden.
- Boxdiagramme (Whisker-Diagramme): Zeigen Datensatz-Quartile und Schnurrflächen, die sich bis zu Nicht-Ausreißer-Extremen erstrecken, und bieten eine klare visuelle Darstellung von Ausbreitung und potenziellen Ausreißern.
- Streudiagramme: Zeichnen Sie zwei kontinuierliche Variablen entlang senkrechter Achsen, um Korrelationen, Clusterbildung und bivariate Beziehungen visuell zu untersuchen.
Best Practices für Enterprise-Dashboards
- Halten Sie konsistente Skalen bei: Stellen Sie sicher, dass Multi-Chart-Vergleiche identische Achsenskalierung haben, um relative Größen nicht falsch darzustellen.
- Priorisieren Sie das Verhältnis von Daten zu Tinte: Entfernen Sie redundante Rasterlinien, unnötige 3D-Effekte und dekorative Elemente, die von statistischen Trends ablenken.
- Design für Barrierefreiheit: Verwenden Sie kontrastreiche, farbenblindfreundliche Paletten mit expliziter Textbeschriftung.
Werkzeuge für deskriptive Statistik
Teradata Cloud und In-Database Compute
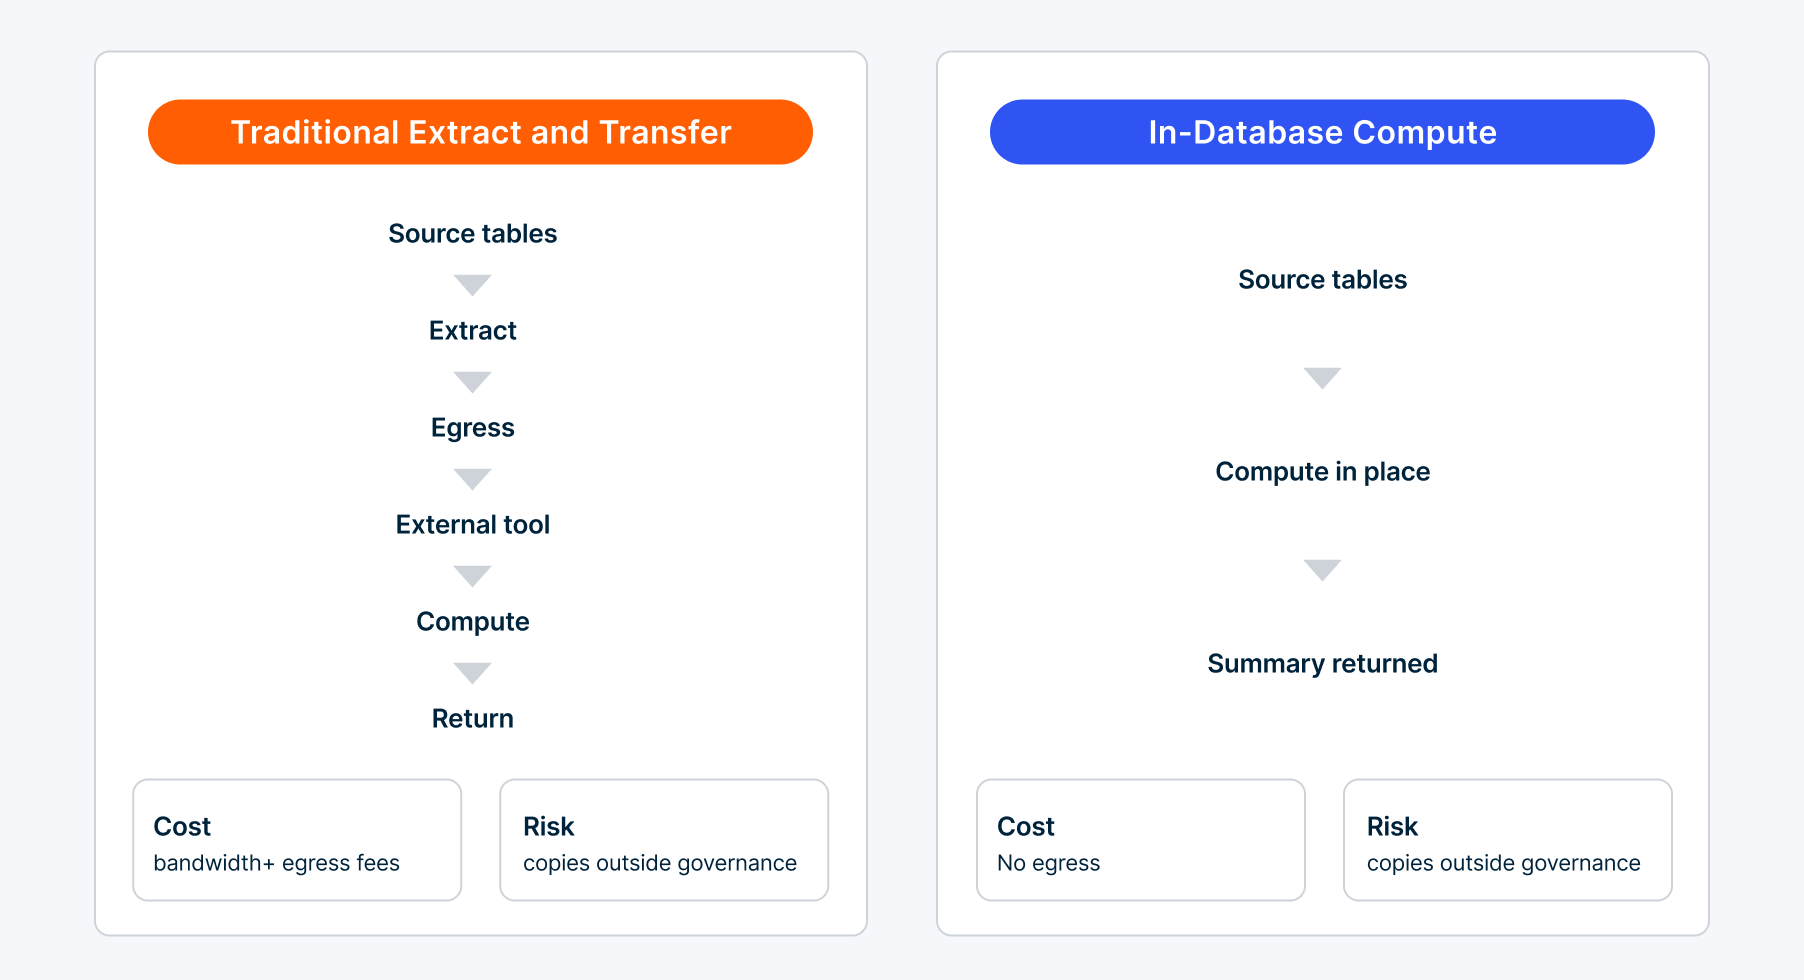
Die Berechnung beschreibender Statistiken über Multi-Terabyte- oder Petabyte-Datalakes mit externen Softwaretools bringt hohe Latenz, Sicherheitsrisiken und Ausgangskosten mit sich. Moderne Analysearchitekturen basieren stattdessen auf In-Datenbank-Verarbeitung.
Die Cloud bietet vernetzte Multi-Cloud-Datenentwicklung und Analysefunktionen. Die Datenbank-Analysefunktionen von Teradata Database führen statistische Berechnungen direkt auf der zugrunde liegenden Speicherarchitektur aus:
- Null Datenbewegung: Berechnen Sie zusammenfassende Statistiken über Tabellen im Petabyte-Maßstab, in denen sich die Daten befinden, und eliminieren Sie Extraktionsstrafen.
- Massiv parallele Verarbeitung: Führen Sie Zusammenfassungsfunktionen – Mittelwert, Standardabweichung, Perzentile – über Milliarden von Zeilen in Sekunden aus.
- Aktive Rechenleistung: Liefert dedizierte, ständig aktive Rechenkapazität für kontinuierliche, hochzeitige Explorations-Workloads.
In-datenbank-analytische Funktionen
Als spezialisierter Funktionssatz bieten die in-datenbank-Analysefunktionen der Teradata-Datenbank spezielle Funktionen, die für deskriptive Statistik, Datenexploration und Feature Engineering entwickelt wurden.
|
Funktionsgruppe |
Was es berechnet |
Wo es hilft |
|
Univariate und deskriptive Funktionen |
Zählungen, unterschiedliche Werte, Nullzählungen, Mittelwert, Varianz, Standardabweichung, Verrägung und Kurtose in einem einzigen Durchgang |
Schnelle Datenqualitätsprofilierung vor der Modellierung |
|
Frequenz - und Histogrammoperatoren |
Häufigkeitstabellen und dynamische Binning-Strukturen für hochdimensionale Attribute, über SQL oder Python |
Verteilungsanalyse ohne Datenexport |
|
Matrix - und Korrelationsanalyse |
Kovarianz- und Korrelationsmatrizen über Hunderte numerischer Merkmale gleichzeitig |
Feature-Auswahl für prädiktive Workflows |
|
Open-Source-Integration |
In-database analytische Funktionen, die aus Standard-Python und R über Notebooks aufgerufen werden |
Vertraute Syntax im Enterprise-Compute-Maßstab |
Open-Source-Integrationen und Teradata University
Die Funktionen der Teradata-Datenbank integrieren sich in Open-Source-Umgebungen, sodass Data Scientists diese analytischen Funktionen mithilfe der Standard-Python- und R-Syntax über Jupyter Notebooks aufrufen können. Um Team-Expertise in der Unternehmensstatistikanalyse aufzubauen, können Praktiker über die Teradata University auf strukturierte Lernwege und Zertifizierungsmaterialien zugreifen.
Umgang mit Ausreißern und Datenanomalien
Quantitative Detektionsmethoden
Datenanomalien und extreme Ausreißer können beschreibende Zusammenfassungen stark verzerren – den Mittelwert vom eigentlichen Zentrum des Datensatzes wegbewegen und die Standardabweichung künstlich aufblähen. Zwei Erkennungsmethoden dominieren:
- Z-Score-Methode: Misst, wie viele Standardabweichungen eine Beobachtung vom Mittelwert entfernt hat. Punkte über drei Standardabweichungen hinaus werden in normalverteilten Daten typischerweise markiert.
- Regel des Interquartils: Identifiziert extreme Werte, die über obere und untere Zäune hinausgehen, die aus dem ersten und dritten Quartil abgeleitet sind.
Managementstrategien für Ausreißer
- Robuste Metrikauswahl: Verwenden Sie bei der Analyse stark verzerrter Betriebsdaten Median- und Interquartilbereich anstelle von Mittelwert und Standardabweichung.
- Datentransformation: Wenden Sie logarithmische, Quadratwurzel- oder Box-Cox-Transformationen an, um die Varianz zu reduzieren und Extremwerte näher an die Mitte zu ziehen.
- Winsorisierung und Begrenzung: Setzen Sie Extremwerte über oder unter ausgewählten Perzentilen auf maximal akzeptable Schwellenwerte, ohne Zeilen zu entfernen.
- Datenbankreinigung: Verwenden Sie Teradata-Datenbankreinigungs- und Nullersatzfunktionen, um Anomalien während der Pipeline-Aufnahme automatisch zu behandeln.
Verwandte Konzepte in der deskriptiven Statistik
- Frequenzverteilungen und Histogramme: Gruppieren einzelne, kontinuierliche Messungen in gleichmäßige Bereiche, um die Verteilungsdichte darzustellen.
- Perzentile und Quartile: Setzen Sie Benchmark-Positionen fest, wie etwa die Antwortlatenz des 90. Perzentils, für die Leistungsbewertung.
- Verrägheit und Kurtose: Schrägheit quantifiziert die Verteilungsasymmetrie; Kurtose misst die Schwanzdicke relativ zu einer Normalverteilung und zeigt die Wahrscheinlichkeit extremer Ereignisse an.
- Korrelation und Kovarianz: Quantifizieren Sie die Richtung und lineare Stärke der Beziehung zwischen zwei stetigen Variablen.
- Multimodale Verteilungen: Verteilungen mit zwei oder mehr unterschiedlichen Spitzen, die separate Subpopulationen innerhalb eines Datensatzes signalisieren.
- Kreuztabellierung: Bewerten Sie Beziehungen zwischen mehrkategorialen Variablen mithilfe von Kontingenztabellen.
- Gewichtete Durchschnitte: Weisen Sie einzelnen Datenpunkten Volumen- oder Wichtigkeitsgewichte zu, damit die zusammenfassenden Kennzahlen die tatsächliche Betriebsrealität widerspiegeln.
Fazit
Beschreibende Statistiken bleiben das Fundament der Unternehmensdatenanalyse. Durch die Bereitstellung zuverlässiger Zusammenfassungen, das Erkennen von Datenanomalien und die Festlegung von Basistrends stellen statistische Zusammenfassungen sicher, dass nachgelagerte Geschäftsinitiativen und fortschrittliche KI-Modelle auf genauen Datengrundlagen basieren. Für das größere Bild sehen Sie, wie KI in der Datenanalyse eingesetzt wird.
Organisationen können statistische Analysen über Cloud-Ökosysteme hinweg skalieren, indem sie beschreibende Funktionen direkt innerhalb ihrer Unternehmensdatenplattformen ausführen. Durch die Beseitigung von Datenbewegungen reduzieren Teams die Rechenzeit, erhöhen die Sicherheit und senken die Kosten für die Analyseinfrastruktur. Die Plattformwahl ist hier entscheidend – siehe Auswahl der besten Datenanalysetools.
Bereit, Enterprise Intelligence zu beschleunigen?
Hören Sie auf, sich mit Datenextraktionsengpässen und teuren Ausgangsgebühren herumzuschlagen. Erleben Sie die Geschwindigkeit, den Umfang und die Sicherheit der Ausführung beschreibender Statistiken und fortgeschrittener Analysen direkt dort, wo Ihre Daten mit der Teradata-Datenbank gespeichert sind.
Bereit zu sehen, wie Datenbankanalysen Ihren Datenworkflow verbessern können?
- Entdecken Sie praktische Lernwege und Analysekurse an der Teradata University.
- Erleben Sie unternehmensweite Datenbankanalysen direkt mit Teradata Trial.
Häufig gestellte Fragen
Was ist deskriptive Statistik?
Was ist deskriptive Statistik?
Deskriptive Statistik ist der Zweig der Statistik, der die Hauptmerkmale eines Datensatzes zusammenfasst und beschreibt, ohne darüber hinaus Schlussfolgerungen zu ziehen. Sie kondensiert große Mengen an Rohdaten in Maße der zentralen Tendenz, Streuung und Verteilungsform – Mittelwert, Median, Standardabweichung, Perzentile –, damit Teams sehen können, was ein Datensatz tatsächlich enthält, bevor sie ihn modellieren.
Was sind die Hauptarten deskriptiver Statistiken?
Was sind die Hauptarten deskriptiver Statistiken?
Es gibt drei Haupttypen deskriptiver Statistiken: 1. Messungen der zentralen Tendenz (Mittelwert, Median, Modus) identifizieren einen repräsentativen Wert. 2. Streuungsmaße (Bereich, Varianz, Standardabweichung, Interquartilbereich) beschreiben, wie weit sich Werte von diesem Zentrum ausbreiten. 3. Positions- und Häufigkeitsmaße (Perzentile, Quartile, Frequenzverteilungen, Verräumung, Kurtosis) beschreiben, wo Werte in der geordneten Menge liegen und die Form der Verteilung.
Was ist der primäre geschäftliche Zweck von deskriptiver Statistik?
Was ist der primäre geschäftliche Zweck von deskriptiver Statistik?
Der Hauptzweck deskriptiver Statistik ist es, die Intuition durch Evidenz zu ersetzen. Die Zusammenfassung der Betriebsdaten in stabile Basislinien ermöglicht es Führungskräften, die Leistung zu benchmarken, Anomalien zu erkennen, bevor sie sich anhäufen, und die Datenqualität zu prüfen, bevor sie in Berichterstattung oder ein KI-Modell gelangen. Es ist das Qualitätsgatter, das bestimmt, ob alles nachgelagert vertrauenswürdig ist.
Was sind gängige Beispiele für deskriptive Statistiken in Unternehmen?
Was sind gängige Beispiele für deskriptive Statistiken in Unternehmen?
Beispiele für deskriptive Statistiken im Unternehmen sind durchschnittlicher Bestellwert und Rückgabequote im Einzelhandel; Wiederaufnahmeraten und Behandlungszeitpläne im Gesundheitswesen; Transaktionsvolumen und Kreditwertverteilungen im Finanzdienstleistungsbereich; Komponententoleranzen und Versandzeiten in der Fertigung. Jede Methode ist eine zusammenfassende Messung, die über eine vollständige Datensatzpopulation berechnet wird, anstatt eine Stichprobe.
Was ist der Unterschied zwischen deskriptiver und inferentieller Statistik?
Was ist der Unterschied zwischen deskriptiver und inferentieller Statistik?
Die deskriptive Statistik organisiert und fasst die tatsächlich vorhandenen Daten zusammen und erhebt darüber hinaus keine Behauptung. Die inferenzielle Statistik nimmt eine Stichprobe und wendet die Wahrscheinlichkeitstheorie an, um Schlussfolgerungen über eine größere Population zu ziehen, wodurch Schätzungen mit einem angegebenen Konfidenzniveau entstehen. Deskriptive Statistik beantwortet, was passiert ist; inferenzielle Statistik schätzt, was anderswo wahrscheinlich wahr ist.
Wie unterstützt Teradata beschreibende Statistiken im Unternehmensmaßstab?
Wie unterstützt Teradata beschreibende Statistiken im Unternehmensmaßstab?
Teradata Cloud führt Zusammenfassungsfunktionen über die in-datenbankbasierten Analysefunktionen der Teradata Database aus und führt Berechnungen dort aus, wo sich die Daten bereits befinden, anstatt sie zu extrahieren. Die massiv parallele Verarbeitung berechnet univariate Zusammenfassungen, Frequenzverteilungen, Varianz- und Korrelationsmatrizen über Milliarden von Zeilen mit aktiver oder elastischer Rechenleistung, ohne Ausgangskosten oder zusätzliche Angriffsfläche.