Überblick
A cloud analytics platform is a set of cloud-hosted services that ingests, stores, processes, and analyzes enterprise data. Most combine a data platform (a warehouse, lake, or lakehouse), elastic compute, and analytics tools. Together, these run reporting, business intelligence, and machine learning workloads without physical hardware to maintain. Organizations pay for the platform by use or by commitment.
For data and analytics leaders, the question is deciding which platform fits best. They need to evaluate how it handles multiple concurrent workloads, what it costs as usage grows, where it can run, and whether it can give AI agents governed access to enterprise data. This guide covers the architectural layers of cloud analytics. It also includes an evaluation framework for testing platforms against those questions.
Key takeaways
- A cloud analytics platform comprises three architectural layers: A foundational data platform, analytics and BI tools, and AI and machine learning services.
- Feature lists rarely separate platforms. Workload concurrency, cost predictability, openness, deployment choice, and governance do.
- Open table formats, unit-economics cost attribution, and governed data access for AI agents define modern evaluation standards.
What makes an analytics platform cloud-based?
An analytics platform is cloud-based when compute and storage capacity are provisioned on demand, billed as consumed, and operated by the provider. Many vendors deliver this as analytics as a service.
Cloud analytics vs. cloud analytics platforms
The platform is the product an organization buys. Cloud analytics is the practice it supports. The distinction matters because a "platform" often connects disparate products, such as a data platform from one vendor, a BI tool from another, and machine learning services from a third. Architects must map these layers before committing to an ecosystem.
Benefits of cloud analytics
- Elastic scale lets compute and storage grow and shrink with demand, a property known as cloud elasticity. So, a quarter-end reporting spike does not require paying for peak hardware all year.
- Consumption-based cost means teams pay for the compute and storage they use. That shifts the financial model from up-front capital expenditure to operational expense.
- Access from anywhere means analysts, distributed applications, and external partners query the same governed data across the network.
- Faster delivery comes from the provider automating provisioning, infrastructure patching, and version upgrades. That allows data engineers to focus on building data products rather than maintaining servers.
These same traits introduce architectural risks, including runaway queries that inflate costs, fragmented data silos across isolated services, and being locked into proprietary storage formats. An evaluation must stress-test these vulnerabilities.
How does a cloud analytics platform work?
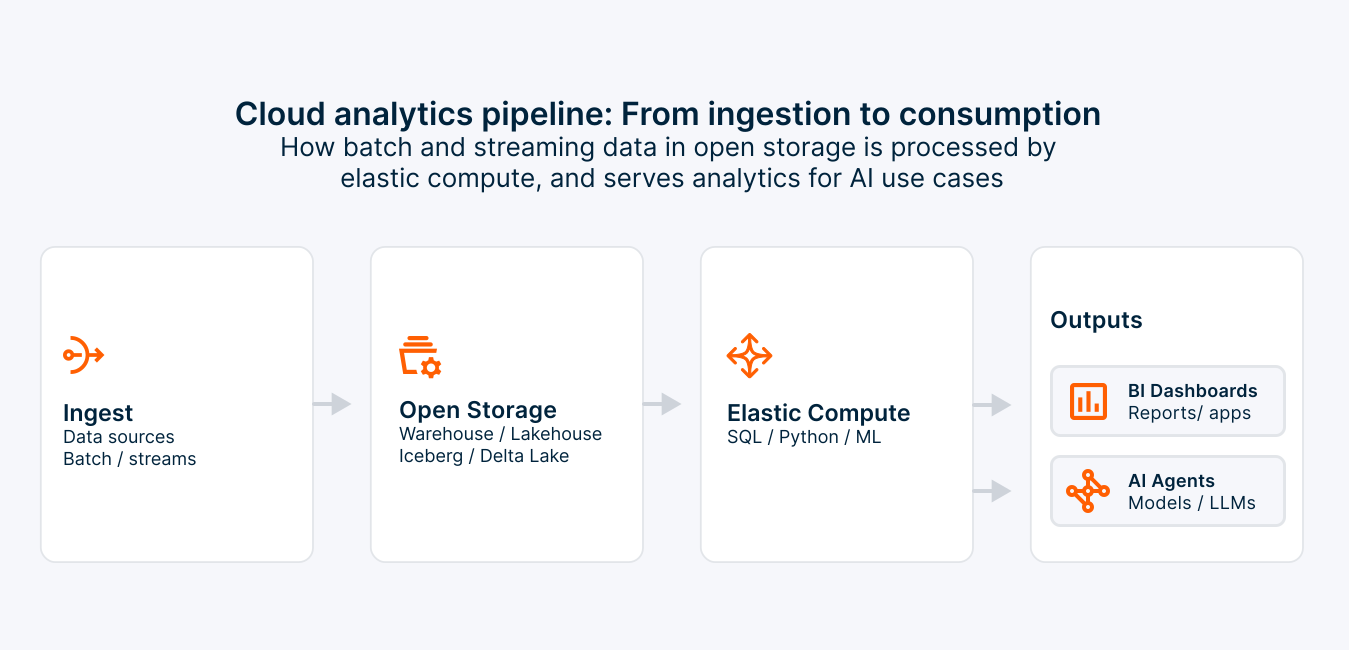
Step 1: Ingest data from every source
Data arrives from operational databases, SaaS APIs, flat files, and event streams. Batch pipelines load historical data on a schedule, while streaming pipelines deliver it continuously for real-time uses like fraud detection. Integration tools clean and reshape the data, either before it arrives or after. Many cloud platforms prefer an extract, load, and transform (ELT) pattern. They load raw data first, then use the platform’s own compute to transform it.
Step 2: Store data in open, governed formats
Data lands in cloud object storage, block storage, or both. Open table formats let several compute engines query the same data (see Lakehouses and Open Table Formats below).
Step 3: Process and query with elastic compute
Query engines execute SQL, Python, and machine learning workloads directly against the stored data. Because modern architectures separate compute from storage, clusters can scale up for heavy reporting periods and spin down to zero when idle. Separate compute clusters also let data scientists run complex ML models without competing with the executive dashboard for resources. The platform's query optimizer and workload manager dictate whether this concurrent execution stays performant or spirals in cost.
Step 4: Analyze, visualize and feed AI
Processed data feeds business intelligence dashboards, embedded applications, and increasingly, AI agents executing autonomous queries. Access for those agents is covered under Governed Data Access for AI Agents below.
The three layers: data platform, BI, and AI
Lists of top cloud analytics platforms often put visualization tools side by side with storage and query engines. Separating the architecture into three layers can clarify what an organization is buying.
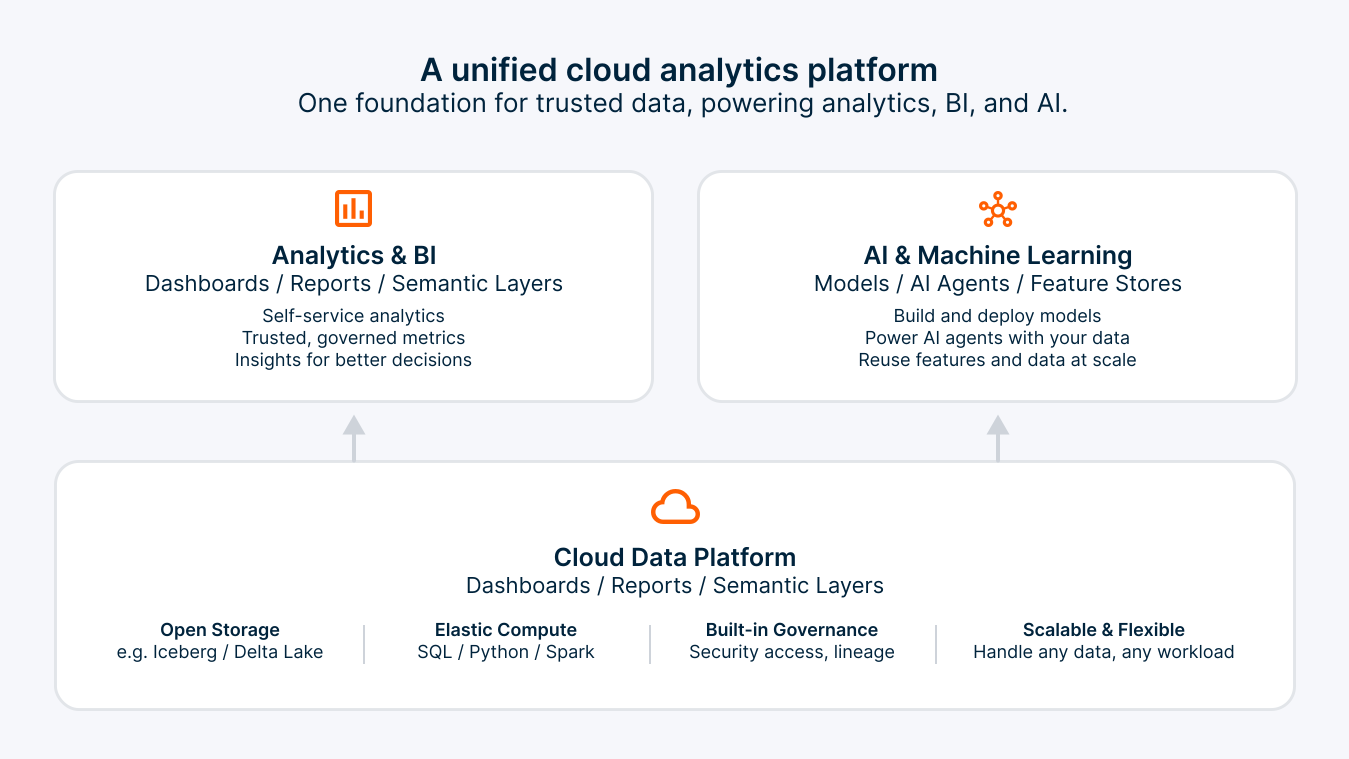
| Layer | What it does | Typical components | Key question to ask |
|---|---|---|---|
| Data platform | Stores, manages, and processes data at scale | A cloud data warehouse, data lake, or data lakehouse; query engines; data integration | Can it run all of our workloads on one governed copy of the data? |
| Analytics and BI | Turns query results into dashboards, reports, and self-service exploration | Business intelligence platforms, semantic layers, notebooks | Does it work with our data platform without extracting the data? |
| AI and machine learning | Trains, runs, and governs models and agents on enterprise data | In-database machine learning, feature and vector stores, model and agent operations | Can models and agents reach the data without leaving governance? |
The cloud data platform anchors the stack, accounts for the majority of costs, and defines overall system performance—making it the most critical layer to assess.
How to evaluate cloud analytics platforms
Assess cloud analytics platforms by how they perform in production, not by their feature lists. Most platforms can ingest, store, query, and visualize data. The real differences appear under pressure situations, like multiple users and queries running at once, storage and compute costs that rise every month, and AI agents that must stay within access controls. The eight criteria below test those conditions.
Evaluation criteria at a glance
| Criterion | What to look for | Questions to ask |
|---|---|---|
| Workload mix and concurrency | Sustained query performance when heavy batch pipelines, complex data science models, and executive reporting collide on the same infrastructure | How does the platform prioritize and isolate workloads when concurrency spikes? Can we isolate experimental ML workloads from production SLAs? |
| Price-performance | Cost per query or per workload at production scale, not list price or raw speed | What would our own workloads cost per month at today’s data volume and query complexity, and at three times that volume? |
| Cost predictability | Pricing models, budgets, alerts, and cost attribution by team or service | Can we commit to a baseline and burst above it? Can we see cost per business unit or per data product? |
| Openness | Open table formats, standard SQL, open-source languages, and no proprietary lock-in for stored data | Can other engines read our tables without exporting them? What would it take to move? |
| Deployment flexibility | Public cloud, hybrid, and multicloud options with the same capabilities in each | Can we run the same platform on premises or in another cloud if regulation or cost requires it? |
| Governance and security | Fine-grained access control, lineage, auditing, encryption, and compliance attestations | Do policies apply the same way to every engine, tool, and agent that touches the data? |
| AI readiness | In-database machine learning, vector search, and governed access for AI agents | Can models and agents run where the data lives, under the same access controls as people? |
| Ecosystem and skills | Connectors for the BI tools, integration tools, and languages the team already uses | Which of our current tools and skills carry over, and which need replacing? |
Weight the criteria by workload. A platform serving thousands of report users needs strong concurrency and workload management. One built mainly for data science needs open formats and in-database machine learning. A platform in a regulated industry needs deployment flexibility and data governance that applies wherever the data goes.
Test platforms on your own workloads
Vendor benchmarks use queries the vendor chooses. A proof of concept should use your own workloads instead: a representative set of reports, pipelines, and models, run at production data volume with a realistic number of concurrent users. Measure response times under load, the total cost of the test period, and the tuning effort each platform required. Published comparisons can help you design the test. For example, Teradata’s workload comparison study evaluates cloud analytics platforms on price-performance and query throughput for enterprise workloads.
What’s changing in cloud analytics platforms
Three shifts are transforming what a good platform looks like. Research firm IDC projects worldwide public cloud spending to pass $1 trillion in 2026, driven by platform-as-a-service and AI platform adoption.
Lakehouses and open table formats
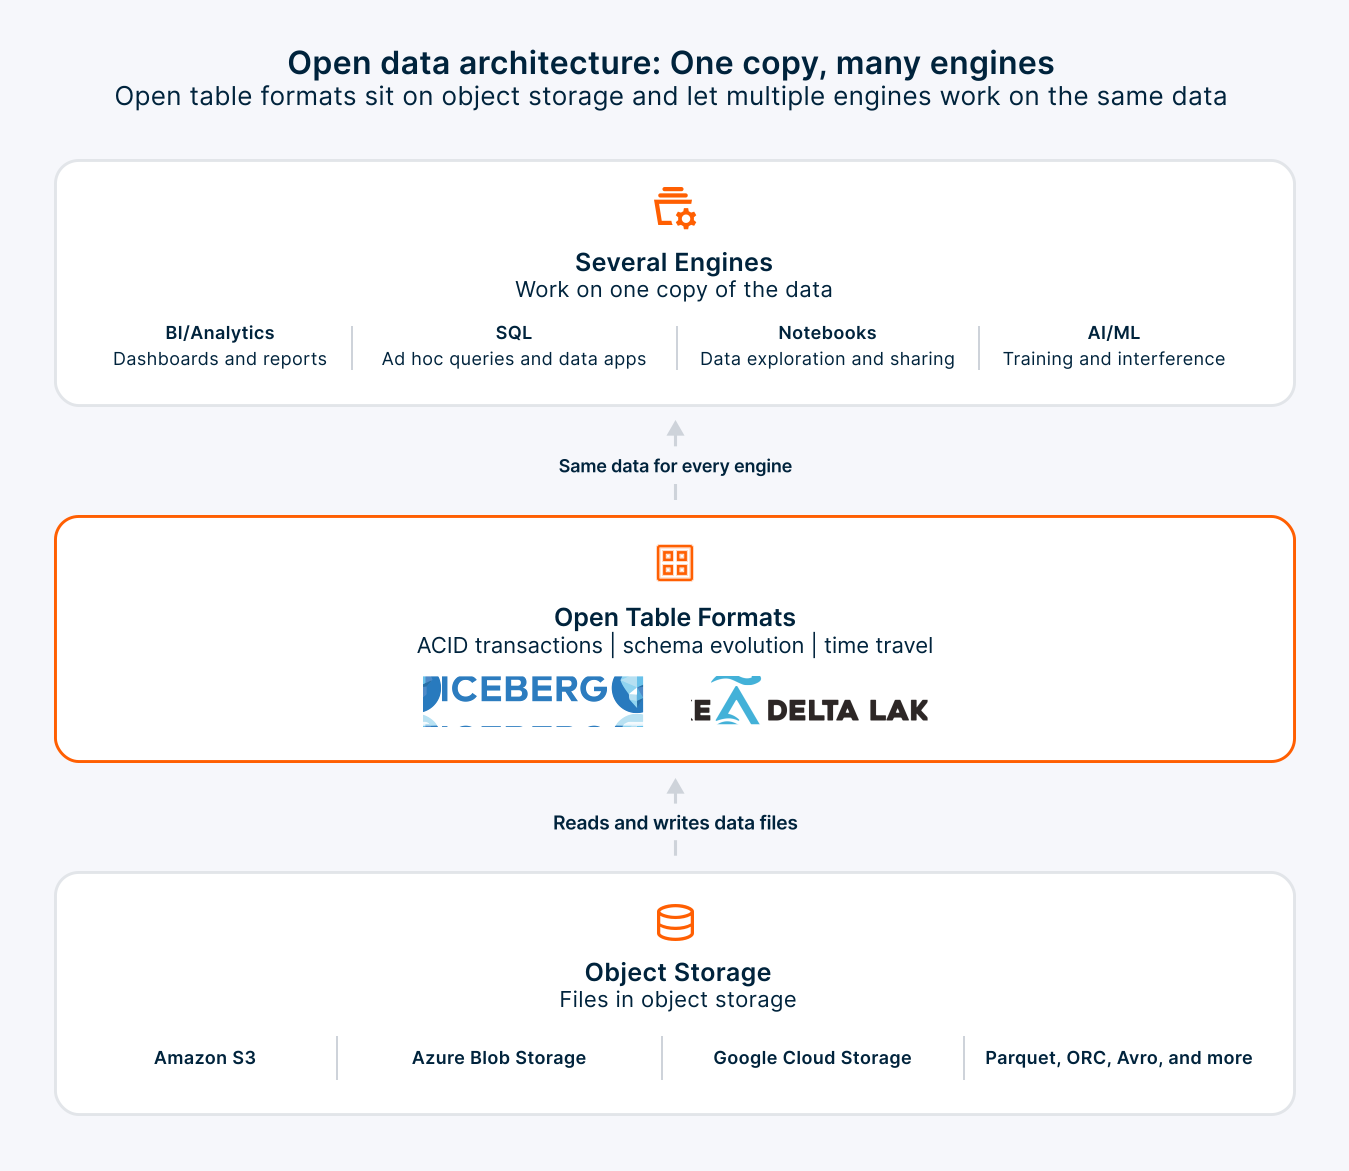
Open table formats such as Apache Iceberg and Delta Lake add ACID transactions, schema evolution, and time travel to files in object storage, so data lakes can support warehouse-style workloads. Because the formats are open, several engines can work on one copy of the data, making this a core test of platform openness.
From cost cutting to unit economics
Cloud cost management is moving from cutting waste to proving value. In Flexera’s 2026 State of the Cloud Report, 49% of organizations tracked a unit metric to improve unit economics (up from 40%). And FinOps team prevalence was 63%. For an analytics platform, predictable spending starts with a pricing model that allows costs to be accurately attributed to specific teams or data products, and tied directly to business results.
Governed data access for AI agents
AI is raising the bar for the data layer. A cloud analytics platform now serves agents as well as analysts, with the same access policies, lineage, and business definitions. And with AI-ready data that does not have to be copied into a separate AI stack.
Cloud analytics built for mixed workloads
Choosing a cloud analytics platform comes down to how it performs under real conditions, like mixed workloads running at once, costs that stay predictable as usage grows, open access to data, and AI that stays within governance. Teradata is built around those tests. The Teradata Autonomous Knowledge Platform runs reporting, data engineering, data science, and AI agents together in one governed system—in the cloud, on premises, or both. Workload management keeps priorities and service levels predictable. Open table format support lets other engines work on the same data. And in-database analytics runs models next to the data instead of exporting it.
To learn more, explore Teradata Cloud or watch our on-demand webinar on cloud analytics architecture.
Teradata has been recognized as a Leader in The Forrester Wave™: Data Management for Analytics Platforms, Q2 2025.
Frequently asked questions
Was ist Cloud-Analyse?
Was ist Cloud-Analyse?
Cloud-Analytik ist die Praxis, Daten auf entfernter Cloud-Infrastruktur zu speichern, zu verarbeiten und zu analysieren, anstatt auf On-Premises-Hardware. Sie nutzt Cloud-Dienste für Speicher, Rechenleistung und Analyse.
Was ist der Unterschied zwischen einer Cloud-Analytics-Plattform und einem Cloud-Data Warehouse?
Was ist der Unterschied zwischen einer Cloud-Analytics-Plattform und einem Cloud-Data Warehouse?
Ein Cloud-Data Warehouse ist eine Komponente. Es umfasst die verwaltete Datenbank, die strukturierte Daten speichert und abfragt. Die breitere Plattform fügt die weiteren Ebenen hinzu: Analytics und Business Intelligence sowie KI und maschinelles Lernen.
Wie werden Cloud-Analyseplattformen bepreist?
Wie werden Cloud-Analyseplattformen bepreist?
Viele verwenden verbrauchsbasierte Preisgestaltung, bei der für die benötigte Rechenleistung und Speicher berechnet wird, oft mit Rabatten für verpflichtete Ausgaben. Einige kombinieren eine feste Basislinie für immer-on-Workloads mit On-Demand-Kapazität für Spitzenzeiten.
Was ist ein Data Lakehouse?
Was ist ein Data Lakehouse?
Ein Data Lakehouse vereint die Zuverlässigkeit und Leistung eines Data Warehouse mit der Flexibilität und Skalierung eines Data Lakes. In einer Cloud-Analyseplattform ist es eine Option für die Data Platform-Schicht, neben einem Cloud-Data Warehouse oder einem Data Lake. Es ist die Schicht, die Analyse- und KI-Tools abfragen.
Was sind die Risiken von Cloud-Analytics?
Was sind die Risiken von Cloud-Analytics?
Die Hauptrisiken sind unvorhersehbare Kosten, Datensilos und Speichersperre. Die Kosten steigen, wenn Abfragen ungeprüft laufen, Datenfragmente über isolierte Dienste hinweg und proprietäre Speicherformate machen das Verlassen teuer. Ein Proof of Concept für Ihre eigenen Workloads, Kostenzuweisung durch Teams und Unterstützung für offene Tabellenformate testen jedes Risiko, bevor Sie sich festlegen.